


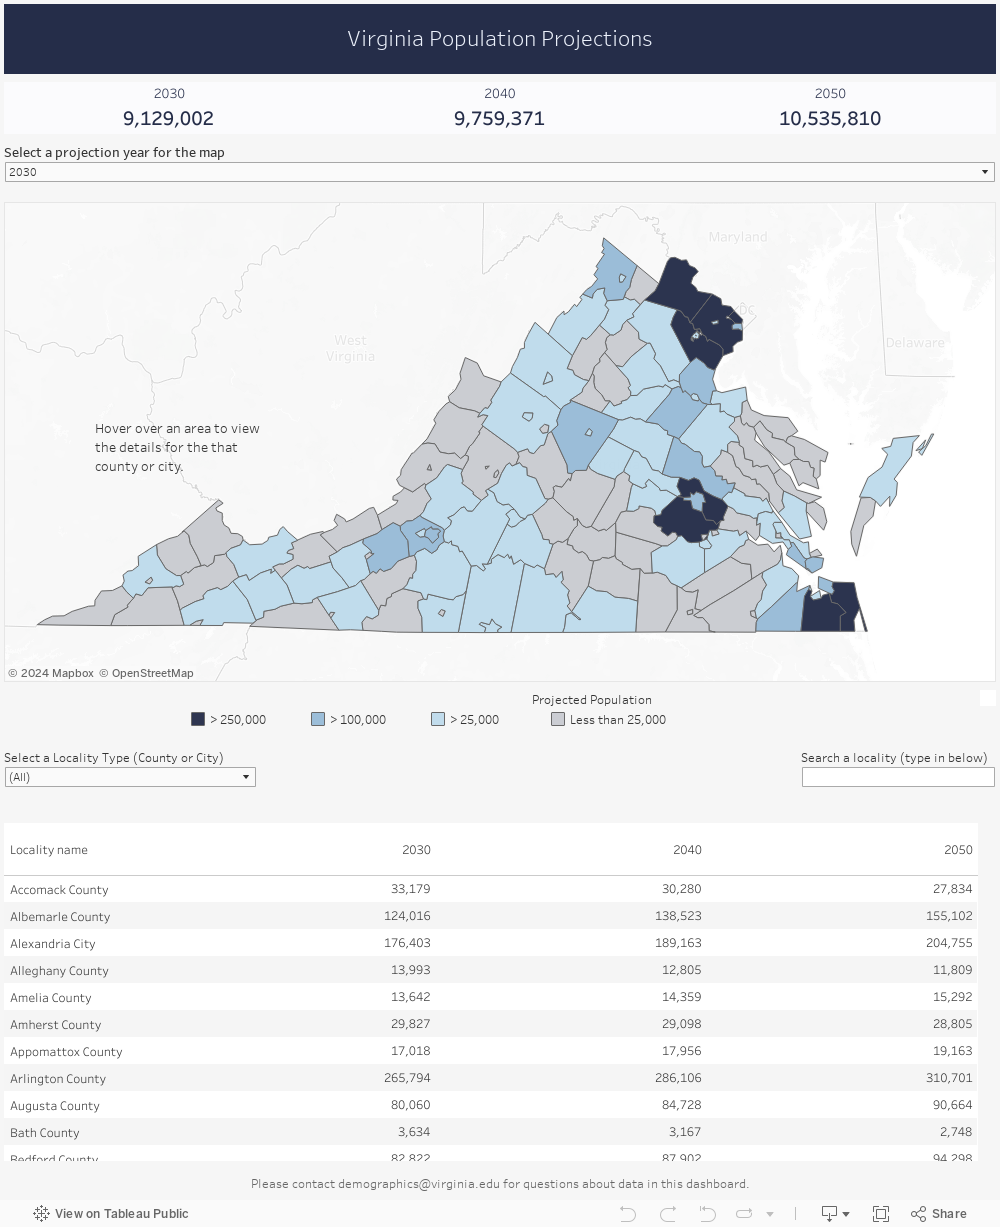
Virginia Population Projections
View all population dataPopulation projections provide an approximate idea of the expected future population size and are used in various sectors (governments, businesses, non-profits etc.) across the Commonwealth, in urban planning, resource allocation for emergency services, prioritizing public and private investments, and in many other ways. With our commitment to providing reliable and credible data to our stakeholders, we will continue to update our population projections with the latest demographic trends.
Citation: University of Virginia Weldon Cooper Center for Public Service. (2022). Virginia Population Projections. Retrieved from https://coopercenter.org/virginia-population-projections
Virginia Population Projection Data
Additional Information
- Understanding Population Projections
Population projections identify the expected future size of the population (and selected subgroups). Projections are used to plan needed services, apply for grants, and justify public and private investments. Because projections attempt to describe the population in the future, they contain two elements that are important to understand before the data can be applied in a meaningful and appropriate way.
First, all projections contain varying degrees of uncertainty, depending on:
- The span of years projected. Projections for the year 2040, for example, are much more uncertain than projections for 2020.
- The size of the geography for which they are developed. Projections for localities are, in general, more uncertain than projections at the state level.
Unanticipated factors that can impact the accuracy of projections (such as cultural, economic, natural/environmental, or political events) are difficult to foresee and to quantify. One can safely conclude, however, that there is less uncertainty about how much can really change between now and 2020 – and much more about what can occur between now and 2040.
Second, the way projections are developed reflects assumptions about the future. These assumptions may be based on past demographic trends, on current local planning and policy, or on deliberate future visioning. Demographers, economists, planners, and policy makers may make different – even conflicting – assumptions that are logical and credible; and those assumptions lead to projections methods that yield
significantly different results.For the purposes established under our contract with the Commonwealth, the Cooper Center’s projections team established the following principles for producing projections for Virginia’s 133 localities:
- The projections method must be applied uniformly to all localities in Virginia; and the necessary input data must be universally available and of high quality.
- The projections method must be guided by rigorous demographic and statistical standards, and carefully tested against census data. The results of this testing must find that the method produces reasonable, consistent projections at both the locality and state levels.
In multiple empirical studies of county-level projections in the states and the nation, typical errors were 12 percent for 10-year projections and 36 percent for 30-year projections. The method we developed produced an error of 4 percent for 10-year projections and 18 percent for 30-year projections.
- State-Wide Projections vs. Local Scenario Projections
Different Purposes, Different Methods
Both statewide and local scenario projections are predictions about the future, but they differ in nature and purpose.
Statewide projections provide one plausible future outcome for all of the localities in the Commonwealth, and for the state overall, by looking at observed past and present trends, and assuming such trends continue. Statewide projections allow comparisons among localities that may be useful for allocating grant funds in areas of greatest need, or for localities to employ as a comparison for their own population patterns. To allow such comparability of data, statewide projections use a uniform process with the same sources of input data for each locality.
Local scenario projections also make assumptions about future conditions, including observations of past trends. These projections, however, typically suggest that past trends may change in the future as the result of local planning and policy priorities; certain environmental or land use constraints; and other factors unique to each locality. These projections provide plausible future outcomes of various "if-then" scenarios and may use data only available in the locality for which the projections are developed.
Both types of projections are valid and useful. An analogy may help to illustrate. Individuals make retirement and financial plans, partly based on their projected longevity. Life expectancies, like statewide projections, are largely based on the observed past, including family history and individual health conditions. They are, by no means, destiny, but rather one of many possibilities. Future conditions and events may change projected life expectancies. Medical advancement may prolong the lifespan; a fatal accident could suddenly end a life. In addition, each individual may actively "plan" for desired future health and longevity, and engage in activities to bring it about, such as quitting smoking and exercising. In this way, life expectancy calculations – like population projections – can be changed based on different scenarios and as a result of external events.
Keep in mind that the future, especially the distant future, is largely unknown and unpredictable. Projections of all types are only as valid as their underlying assumptions. Empirical studies show the average error for 30-year projections at the county level is 36%. Nonetheless, both statewide projections and local scenario projections provide a platform for community and state planning and engagement.

Metro Areas Will Grow Larger, Rural Areas Will Grow Older


